In this post I will discuss classical approaches for profiling Python code, which is an unavoidable step in code optimization. We will review most popular profiling tools for Python such as cProfile, snakeviz and py-spy.
Using cProfile
The simplest way to profile Python code is to use the cProfile module from the standard library. For instance, let's profile the following script, which computes the Mandelbrot set.
mandelbrot.py
import numpy as np

def kernel(x, y, max_iters):
    """Determine if complex number (x + iy)  is a candidate
    for membership in the Mandelbrot set"""
    c = complex(x, y)
    z = 0.0j
    for i in range(max_iters):
        z = z * z + c
        if (z.real * z.real + z.imag * z.imag) >= 4:
            return i
    return max_iters

def mandel(image, min_x=-2, max_x=1, min_y=-1, max_y=1, iters=100):
    height, width = image.shape
    pixel_size_x = (max_x - min_x) / width
    pixel_size_y = (max_y - min_y) / height
    for x in range(width):
        real = min_x + x * pixel_size_x
        for y in range(height):
            imag = min_y + y * pixel_size_y
            image[y, x] = kernel(real, imag, iters)

x = np.zeros((256, 256), dtype=np.uint8)
img = mandel(x)
To profile this script we can run,
python -m cProfile -s tottime mandelbrot.py
where -s tottime allows sorting by total run time. It would produce,
         150995 function calls (147755 primitive calls) in 0.766 seconds

   Ordered by: internal time

   ncalls  tottime  percall  cumtime  percall filename:lineno(function)
    65536    0.556    0.000    0.556    0.000 mandelbrot.py:4(kernel)
      317    0.027    0.000    0.027    0.000 {built-in method builtins.compile}
        1    0.025    0.025    0.581    0.581 mandelbrot.py:16(mandel)
      139    0.024    0.000    0.024    0.000 {built-in method marshal.loads}
    33/31    0.013    0.000    0.015    0.000 {built-in method _imp.create_dynamic}
      452    0.008    0.000    0.022    0.000 re.py:271(_compile)
        1    0.006    0.006    0.013    0.013 fromnumeric.py:3(<module>)
  335/332    0.006    0.000    0.009    0.000 {built-in method builtins.__build_class__}
We can see that the kernel function in called 65k times in a double loop and
accounts for 96% of commutated run time of the mandel function. Therefore
this function and the double loop in general would be a good candidate for
optimization, either by vectorizing it with numpy, or using
Cython or numba.
Visualizing profiling results with snakeviz
The cProfile CLI interface is useful, however to re-order profiling results by a different key (e.g. number of calls or cumulated time) one has to either re-run profiling anew or remember how to use the pstats module. A much easier way to interactively explore profiling results is to use snakeviz.
We would first save the profiling results to file with,
python -m cProfile -o mandelbrot.prof mandelbrot.py
and then run snakeviz on it,
snakeviz mandelbrot.prof
This would would start a web-server where we can interactively explore results either as a flame graph or a dynamic table.
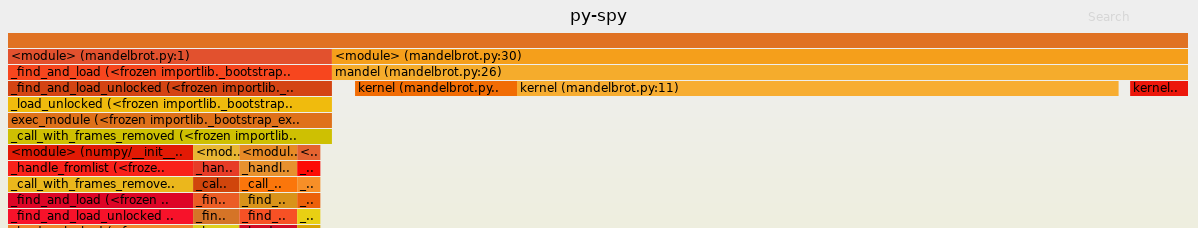
Sampling profiling with py-spy
cProfile runs in the same process as our code, and results in some overhead which might bias results. Profiling complex system also requires some code modification, to indicate which parts to profile, which is an issue for systems in production. An interesting recent project which addresses these concerns is py-spy. It is a sampling profiler that runs in a separate process. It can be used to visualize profiling results as SVG,
py-spy record -o mandelbrot-profile.svg -- python mandelbrot.py
In addition, py-spy allows real-time profiling with a top-like interface,
py-spy top -- python mandelbrot.py
It can also profile any running Python process specified by a PID, with,
py-spy top --pid <PID>
which is particularly useful for profiling code running in production, without affecting it.
Generally, py-spy has more advanced features such as support for tracking subprocesses, native extensions (in Cython C, C++) and the percentage of Global Interpreter Lock (GIL) use for multi-threaded programs.
The downside of py-spy is that since it relies on system-calls, in some cases
it would require to run as sudo as a workaround for permission issues.
Conclusions
Overall, to profile simple and isolated pieces of code cProfile + snakeviz for visualize is a good start. For more advanced use cases, or when profiling code in production, py-spy certainly the appropriate solution.